Technical Analsys
Technical Analysis #C-COCOA : 2019-05-22
There is a lack of rain in West Africa and especially in Côte d'Ivoire. Will the cocoa quotations continue increasing ? Cote d'Ivoire farmers report a lack of moisture, which leads to the production of poor quality beans. This may reduce the harvest in the current intermediate season, which lasts from April to September. According to Cocobod, cocoa production in Ghana during the current crop season will be reduced to 850 thousand tons from 900 thousand tons a season earlier. In the mid-May, the International Cocoa Organization (ICCO) confirmed the forecast of world cocoa production in the season 2018/19 amounted 4.8 million tons. Of these, Côte d'Ivoire accounts for 2.2 million tons, or about 46%. If crop forecasts are revised downwards due to the development of drought in African countries, this may contribute to the growth of cocoa quotations.
On the daily time frame Cocoa: D1 approached the upper boundary of the long-term neutral trend. Before opening a buy position, it must be pierced to the top. Various technical analysis indicators have generated upside signals. Further growth of quotations is possible in case of bad weather and a reduction in world yield.
The Parabolic indicator demonstrates signal to increase.
The Bolinger® bands narrowed, indicating volatility decrease. Both lines of Bollinger have a slope up
The RSI indicator is above the 50 mark. It has formed a divergence to the rise.
The MACD indicator shows an uptrend signal.
The bullish momentum may develop if Cocoa exceeds the resistance line of the long-term neutral trend: 2450. This level can be used as an entry point. The initial stop loss may be placed below the last lower fractal, the Parabolic signal, the 200-day moving average line and the lower Bollinger line: 2222. After opening the pending order, we shall move the stop to the next fractal low following the Bollinger and Parabolic signals to the next fractal minimum. Thus, we are changing the potential profit/loss to the breakeven point. More risk-averse traders may switch to the 4-hour chart after the trade and place there a stop loss moving it in the direction of the trade. If the price meets the stop level (2222) without reaching the order (2450), we recommend to close the position: the market sustains internal changes that were not taken into account.
Technical Analysis Summary
- Position Buy
- Buy stop Above 2450
- Stop loss Below 2222
Market Overview
- Markets recover after Huawei ban exception
- Dollar rises despite fall in existing home sales
US stock market rebounded on Tuesday after White House granted 90-day exceptions to export ban against Huawei Technologies. The S&P 500 gained 0.9% to 2864.36. Dow Jones Industrial Average added 0.8% to 25877.33. The Nasdaq rose 1.1% to 7785.72. The dollar resumed strengthening despite a report existing home sales fell 4.4% in April from a year earlier. The live dollar index data show the US Dollar Index, a measure of the dollar’s strength against a basket of six rival currencies, rose 0.1% to 98.014 and is higher currently. Futures on US stock indexes point to lower openings today.
DAX 30 outperforms European indexes
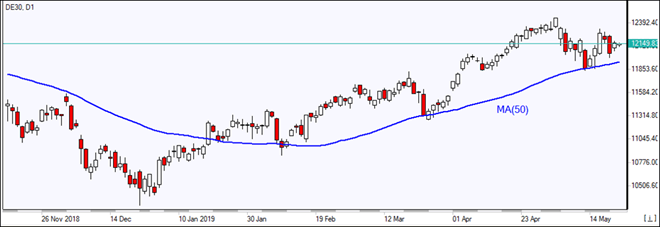
European stocks ended higher on Tuesday as market sentiment was buoyed by US delay of Huawei exports ban. Both the EUR/USD and GBP/USD continued their slide and are lower currently. The Stoxx Europe 600 ended 0.5% higher led by technology shares. The German DAX 30 rose 0.9% to 12143.47, France’s CAC 40 gained 0.5%. UK’s FTSE 100 added 0.3% to 7328.92 as Prime Minister May offered lawmakers a vote on whether to have a second Brexit referendum if they approved her withdrawal deal.
Shanghai Composite pulls back
Asian stock indices are still mixed today. Nikkei gained 0.1% to 21283.37 despite reports Japanese exports declined for the fifth straight month in April while yen resumed its climb against the dollar. Chinese stocks are mixed: the Shanghai Composite index is down 0.5% while Hong Kong’s Hang Seng index is 0.2% higher. Australia’s All Ordinaries index added 0.2% as Australian dollar continued its decline against the greenback.
Brent down on US inventories build forecast
Brent futures prices are edging lower today. The American Petroleum Institute late Tuesday report indicated US crude inventories rose by 2.4 million barrels last week. Prices slipped yesterday. July Brent lost 0.3% to $72.18 a barrel on Tuesday. Today at 16:30, CET the Energy Information Administration will release US Crude Oil Inventories.


