- Bitcoin is under pressure and has slipped below support at $26,500
- Meanwhile, Ethereum has been on a downward trajectory since reaching $2,100 in April
- A potential positive catalyst for both cryptos remains the approval of spot ETF applications
As we enter the final quarter of 2023, Bitcoin remains under pressure due to various macroeconomic challenges and uncertainties in national economies.
Similar pressure is affecting Ethereum, but when we compare the performance of ETH to BTC, it becomes evident that ETH continues to lag behind, reaching its lowest point of the year last week.
While Bitcoin did experience a brief recovery trend, reaching $27,400 last week, it faced a downturn following the Fed's decision, persisting in negative territory ever since.
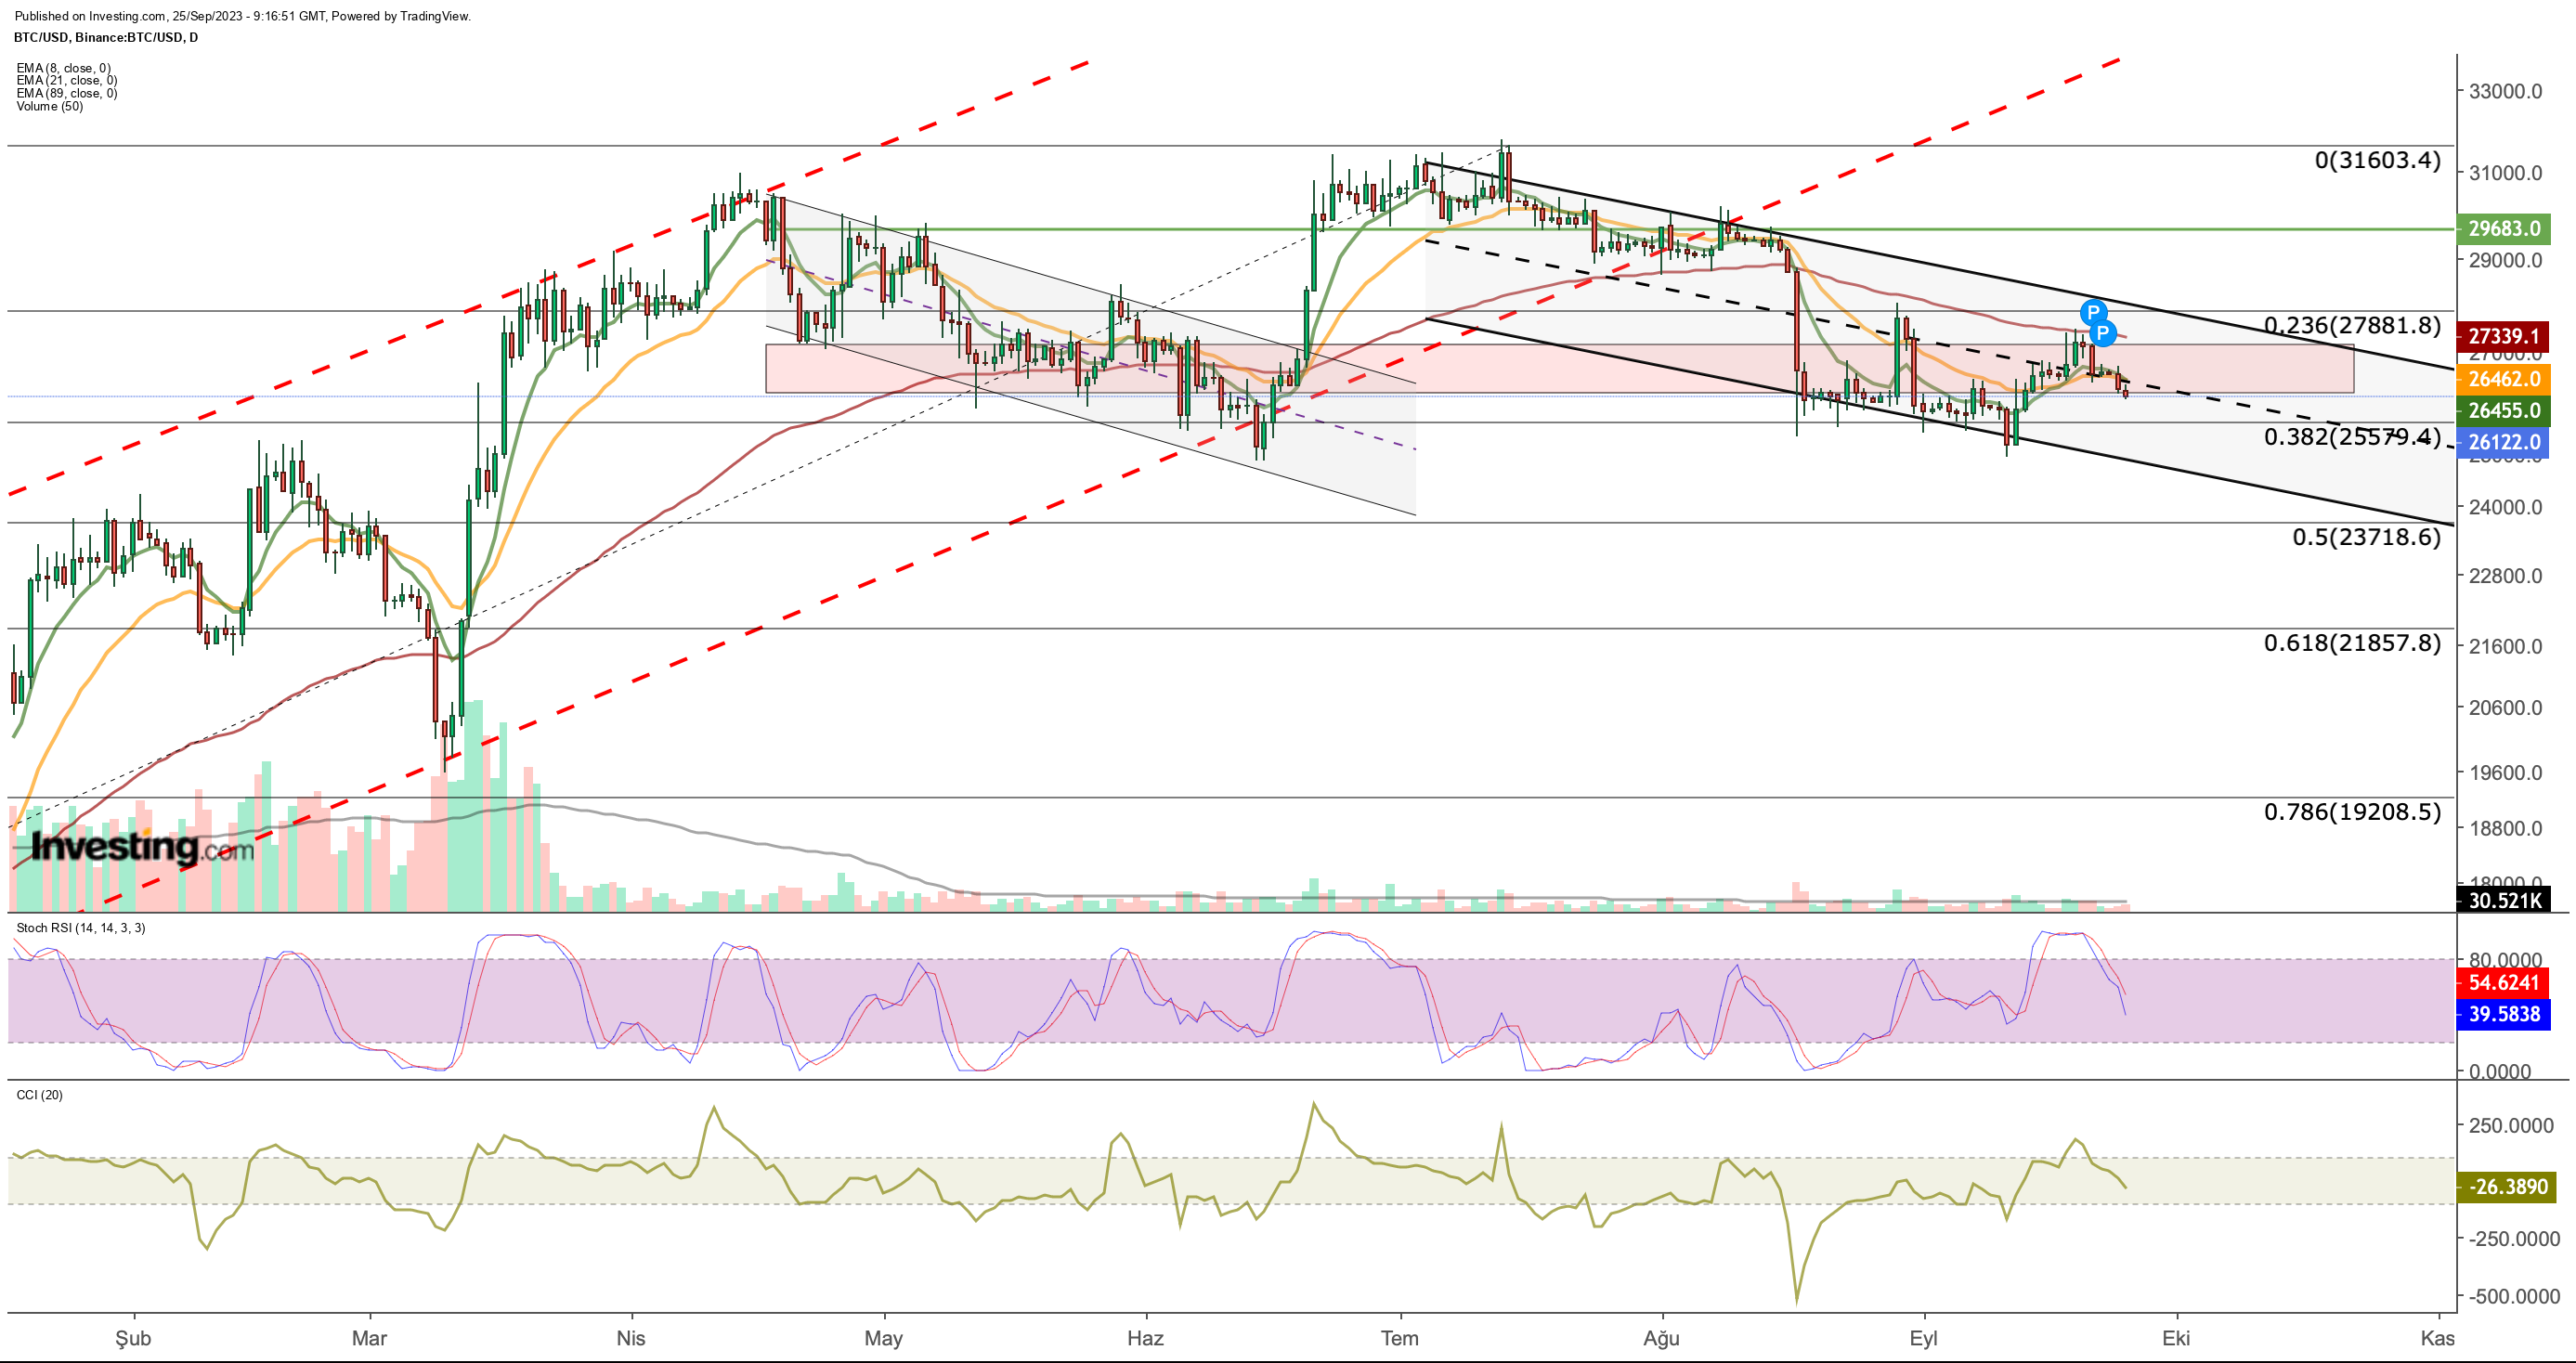
From a technical perspective, the BTC price has returned to a crucial point, corresponding to the 50-day moving average (MA) value. This reaffirms that the MA value serves as a critical resistance level for BTC. 
In the present circumstances, Bitcoin has slipped below its intermediate support at $26,500 due to recent selling pressure. It remains within a short-term downward channel that has been observed since July, without crossing the midline.
Consequently, the closest support level to monitor in the current downward trajectory this week is the Fibonacci 0.382 value at $25,500. It's possible that Bitcoin could experience selling, pushing it down to around $24,800.
If the ongoing bearish trend intensifies and the descending channel breaks, Bitcoin could swiftly drop below $22,000, which aligns with Fibonacci 0.618.
While short-term technical indicators suggest the potential for further declines in Bitcoin, a resurgence in demand within the lower band of the channel might enable BTC to reverse its direction upwards.
To shift its negative outlook, Bitcoin must break through the resistance line at around $28,000 with substantial trading volume. The 200-day moving average, situated near the $28,000 mark, represents a critical level for a potential trend reversal.
Even if Bitcoin experiences upward movements in the near future, it must rise above the $27,000 - $28,000 range to reduce the likelihood of establishing lower lows within the current downtrend.
Furthermore, we observed in the past that the upward rebound during the April to June decline was triggered by the approval of BlackRock (NYSE:BLK)'s spot ETF application.
As we move into the final quarter of 2023, a similar effect could occur, potentially with the approval of spot ETF applications.
Aside from this development, there are no significant positive catalysts on the horizon for the cryptocurrency market.
Consequently, any delays or unfavorable outcomes regarding ETF approvals pose the risk of accelerating outflows across the cryptocurrency market, particularly affecting Bitcoin.
Ethereum: Technical View
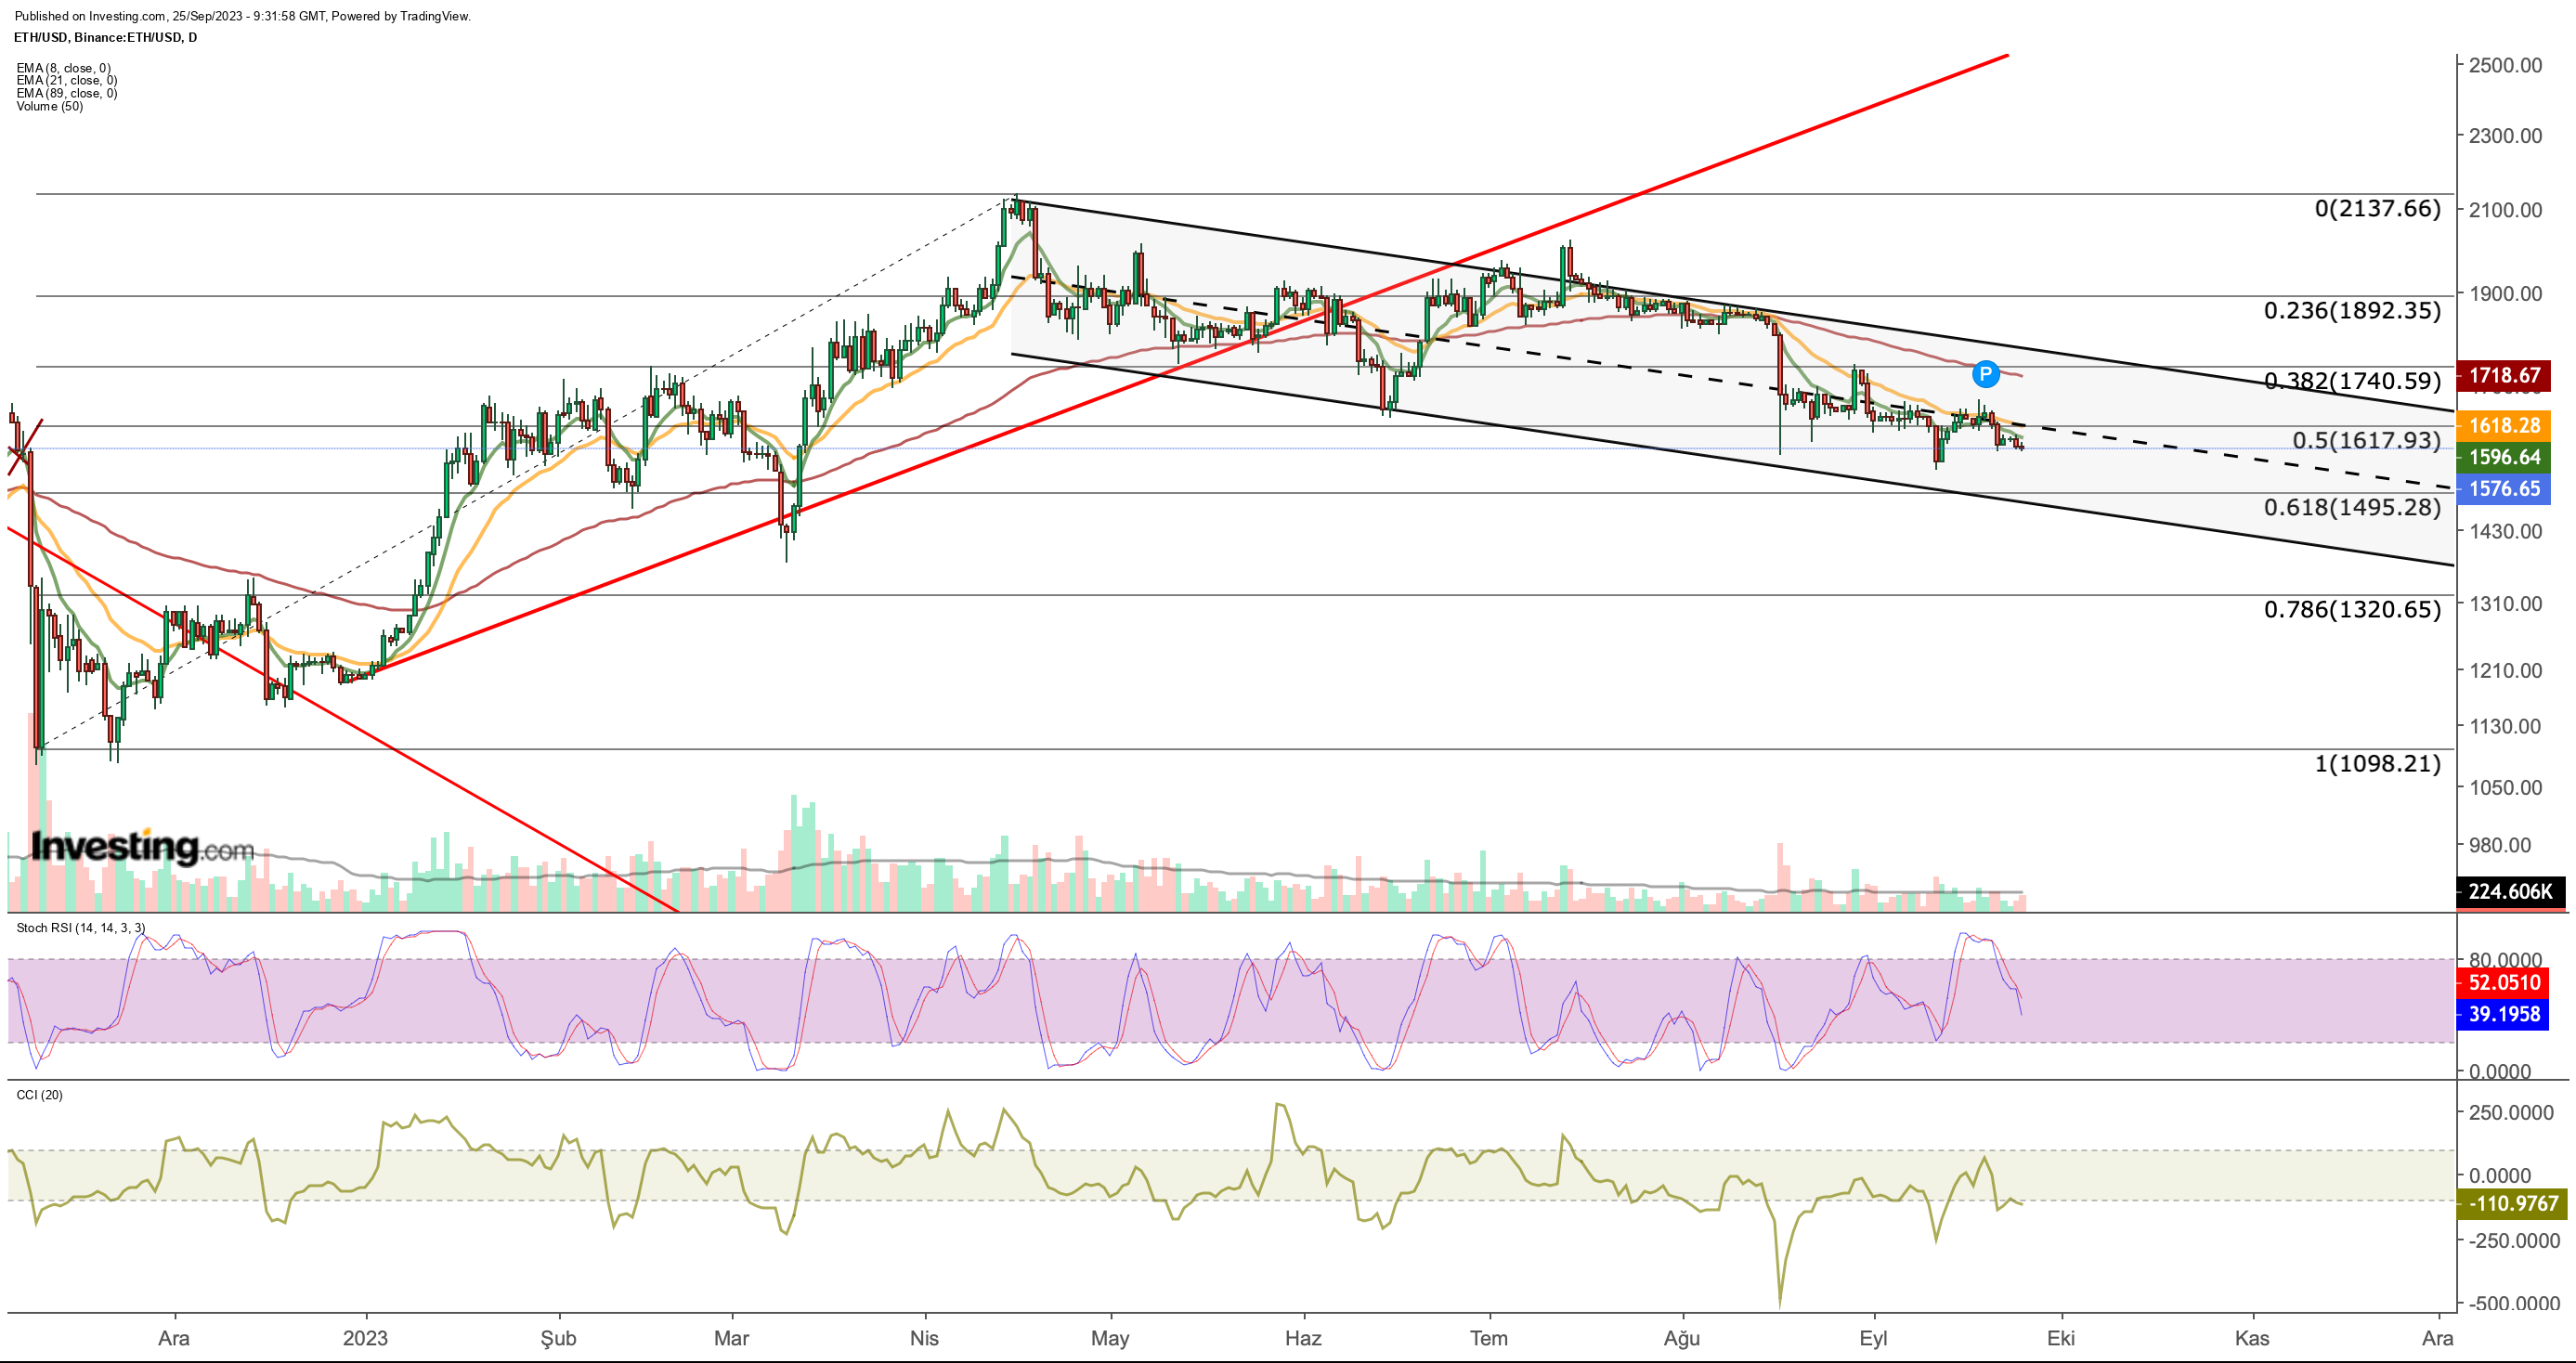
Ethereum has been on a downward trajectory since reaching its peak in the $2,100 range back in April of this year.
Throughout the summer, Ethereum grappled with the upper boundary of a descending channel, facing resistance as it attempted to breach the $1,900 mark.
Subsequently, mounting selling pressure forced a gradual descent in ETH's value, ultimately landing it in the $1,600 region.

In this gradual decline, Ethereum recently slipped below the critical $1,600 support level. Consequently, there is now a potential for Ethereum to slide toward the support range just below $1,500.
To avert this downward momentum or potential trend reversal, it becomes crucial for Ethereum to achieve a close above $1,620 this week.
Failing this, the prevailing outlook suggests a further descent towards the $1,400 region, which aligns with the lower boundary of the descending channel.
Conversely, in the event of daily closes above $1,620, the $1,750 level would come into focus as the next significant resistance zone. Breaking through this region would mark a pivotal development in reversing the prevailing downward trend.
On another note, if demand resurges following Ethereum's retreat to the $1,400 region in the coming days, it could propel the cryptocurrency back toward the $1,700 area.
Such a move would align with Ethereum's historical pattern of moving back and forth within the confines of the channel.
***
Disclaimer: This article is written for informational purposes only; it does not constitute a solicitation, offer, advice, counsel or recommendation to invest as such it is not intended to incentivize the purchase of assets in any way. As a reminder, any type of assets, is evaluated from multiple points of view and is highly risky and therefore, any investment decision and the associated risk remains with the investor. The author does not own the stocks mentioned in the analysis.

