European equity markets were routed Monday after Greece instituted capital controls and declared a bank holiday. Germany’s DAX fell 3.6%, while Italy’s FTSE MIB was down 5.2%. Greece’s stock market will reportedly be closed for at least a week.
Yet despite the attention Europe will receive in the coming weeks, another crisis of greater significance may be taking shape.
In China, stocks are plunging at a breathtaking pace. Monday was particularly volatile. The Shanghai Stock Exchange Composite Index actually opened 2.5% higher, buoyed by China’s benchmark lending rate cut and lowered bank reserve requirement ratios. Gains were fleeting, however, as the Shanghai Composite plunged as much as 7.6% before paring losses to close down 3.3%.
The easing measures announced over the weekend are ostensibly aimed at supporting China’s deteriorating economy. But the timing of the moves suggests a desperate attempt to prop up Chinese equities. The Shanghai Composite was up 60% in 2015 as of June 12, but had suffered a 19% decline just before the interest rate cut.
Some believe China’s extraordinary stock market performance amounts to a speculative bubble. Others probably see a cheap market that got overheated and is poised to head even higher in the coming months.
Either way, the term “bubble” is completely overused nowadays. To figure out what’s going on in China, I compared today’s situation with a classic speculative mania – the U.S. technology-stock bubble.
In March 2000, the NASDAQ Composite Index had more than doubled in just one year and had risen an astounding 500% over five years.
During the tech bubble, the U.S. stock market reached its highest valuation ever. However, in comparing the tech bubble to China’s current situation, I’m only going to select U.S. technology stocks because they were the most egregiously overvalued. I’ll use the very peak of the U.S. stock market on March 10, 2000 as my reference point.
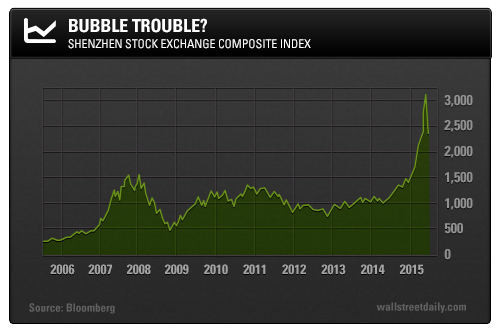
Simply put, the present-day equivalent of the NASDAQ is the Shenzhen Stock Exchange Composite, which has a higher percentage of technology stocks and is slightly smaller in aggregate market cap than its counterpart in Shanghai. As of June 12, 2015, the Shenzhen Composite was up an extraordinary 122% year to date.

Since its peak, the Shenzhen Composite has declined a harrowing 25% in a little over two weeks (as of Monday’s close). So, is the Shenzhen a huge bubble that’s bursting? Let’s begin the bubble battle to find out.
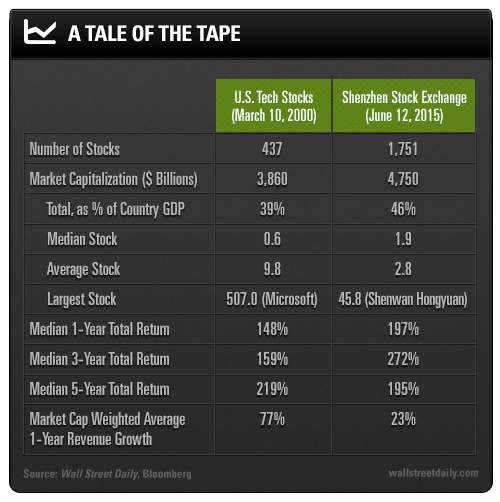
Below, I’ve compared various metrics at each market’s respective peak to assess the relative sizes.

As you can see, the Shenzhen Stock Exchange is actually bigger than the tech bubble in terms of the number of companies and aggregate market capitalization.
A dollar in 2000 is worth more than a dollar in 2015, so I’ve compared the aggregate market cap of both groups with each country’s respective gross domestic product (GDP) at the time. The peak of the Shenzhen exchange was bigger in relation to the overall economy, as well.
Because the Chinese government owns a significant portion of the total equity market, some of the collateral damage from declining Chinese equities may be mitigated. For example, government agencies own over half of the largest company on the Shenzhen exchange, Shenwan Hongyuan Group Co Ltd (SZ:000166).
Shenwan is a securities brokerage firm that, ironically, is exacerbating the decline in China’s market as it issues margin calls.
I doubt the Chinese farmers and other inexperienced investors—who rushed to open up brokerage accounts so they could speculate on the rising market—even knew that their accounts could be forcibly liquidated once losses mounted.
In fact, it’s easy to see the impact of myriad new investors – and the high degree of margin debt – by looking at the median stock total return performance data. Stocks on the Shenzhen exchange experienced a ramp that was even more vertical than the tech-stock bubble. That creates an almost irresistible fear of missing out.
Meanwhile, there’s a big difference in sales growth. The U.S. stock market’s optimism was actually more grounded in reality – if that’s even possible. Revenues at many tech firms were exploding. The Internet was becoming an integral, transformative aspect of the economy. However, the stock market had reflected that reality prematurely and without regard for profits (or lack thereof).
Now, let’s get to the heart of the matter. That is, can we truly characterize Chinese equities as in a bubble?

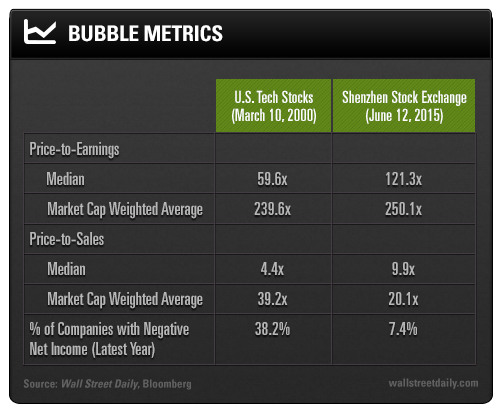
The median price-to-earnings (trailing) and price-to-sales ratios on the Shenzhen exchange were twice the level reached during the apex of the U.S. tech bubble.
The market cap-weighted average P/E of 250x could be the highest ever attained by a broad group of stocks. Even the 34 utilities on the Shenzhen exchange were absurdly valued, with a median P/E of 56x and median P/S of 5.6x, but median one-year sales growth of just 3.3%.
Ladies and gentlemen, we’re witnessing a historic speculative mania in China. To be sure, we may not have seen the ultimate peak for Chinese equities – the bubble could always get bigger.
The Shenzhen Bubble does have a smaller percentage of companies with negative earnings, although this may offer little solace in the midst of an economic expansion fueled by a credit binge and rife with malinvestment.
China’s equity bubble has important ramifications for global markets. Policymakers in China not only have to contend with a housing bubble, but also a stock market bubble.
After its peak in March 2000, the NASDAQ declined 78% in around two and a half years. Tech stocks didn’t fully bottom until their market cap-weighted average P/E fell below 45x.
Despite a 25% decline in the Shenzhen Composite, the market cap-weighted average P/E is still 170x. In other words, it could be a long, hard bear market (punctuated by hellacious rallies).
Meanwhile, the central planners in China will do everything they can to hold things together…but I’m certainly not convinced it’s within their power, given the enormity of the problems.
Just imagine if the United States had faced the tech and housing bubbles concurrently, and you get a sense of what they’re up against.
