T2108 Status: 21.0% (intraday low of 19.9% – essentially oversold)
VIX Status: 20.5 (retested level that launched summer swoon in 2011)
General (Short-term) Trading Call: Scale into longs for short-term bounce from oversold conditions
Active T2108 periods: Day #1 under 30% (underperiod), Day #2 under 40%; Day #20 under 70% (underperiod)
Commentary
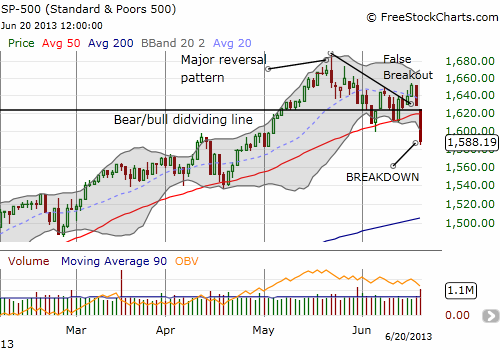
If I had a bearish bias coming into today, I would have collected a large payday on ProShares Ultra S&P 500 (SSO) puts. Even sticking with the older plan of playing a breakdown from the wedge would have yielded great results today as the S&P 500 (SPY) gapped down exactly under the bear/bull dividing line and sold off in a near straight line from there. However, just as I did not play the breakout (thank goodness for wariness ahead of the Fed meeting!), I did not play the bearish angle of today’s breakdown as I was on watch for oversold conditions.

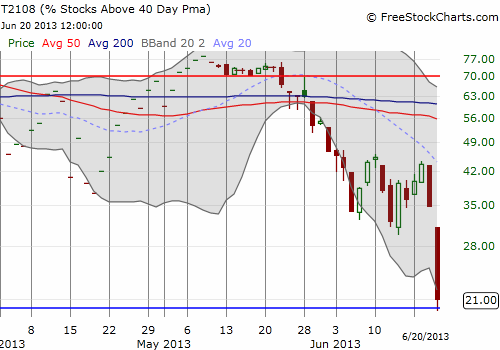
Today’s 2.5% loss on the S&P 500 (SPY) was the index’s largest loss since a 3.7% plunge November 9, 2011. T2108 plunged in response with a gut-wrenching 39.6% loss down to 21%. This was T2108′s largest one-day loss since a 49.1% plunge on May 21, 2010 where T2108 hit an amazingly low 9.7%. The 52.0% 2-day plunge was T2108′s largest since a 56.1% 2-day loss on August 8, 2011 when T2108 closed at 11.5%. Since 1990, there have only been 18 occurrences of T2108 dropping at least as much as it has done in the past two days. Like today, all of these plunges happened below both the 20 and 50DMAs. At its low for the day, T2108 hit 19.8%, oversold conditions (the picture-perfect and sharp bounce from oversold levels tells me I am not the only one watching these levels closely!). Put this all together and not only is T2108 quasi-oversold, but it is also essentially (classically) oversold.

The sheer scale of what happened today took me off-guard. I did not think the market would hit oversold conditions until next week and certainly not drop with such ferocity!
As on previous occasions with the potential for (quasi) oversold conditions, I ran the T2108 Trading Model (TTM) to look for an early start on trading. As I noted in an earlier post, I learned that sensitivity analysis is important in interpreting the results. I have not yet adjusted the code to accommodate multiple scenarios, but I did run the model several times throughout the day. The results were VERY instructive. I tweeted some of these (in chronological order):
The day ended with a projection of a 72.2% chance of an up day tomorrow (June 21st). The model is a single node because the entire “problem space” only contains 18 cases. And these 18 cases are remarkably similar to the current one. Of these 18 cases, the S&P 500 closed down only 5 times the following day. The range of returns has been extremely wide: as low as -6.6% on August 8, 2011 to +6.3% on November 21, 2008. Thirteen (13) of the eighteen (18) cases have occurred since 2007, one in 2011, and none in 2012. I said prepare for volatility this summer, and boy do we have it.
With the S&P 500 trading well below its lower-Bollinger Band, a PERFECT scenario tomorrow will be another gap down that really over-stretches the selling. I will be loading up on SSO calls at the point with T2108 most likely in a deep oversold position, and the index stretched well-beyond the typical band of recent volatility. Of course, I will not complain if the index instead gaps up tomorrow, but I think there is a lot more money to be made playing deep oversold levels.
Even though I remain bullish, I have heaps more caution to throw on the table for good measure. The S&P 500 has technically broken down. I can play oversold bounces for one, maybe two days – however long it takes to rally back into overhead resistance. The bulls now have a LOT to prove and will have a major hurdle ahead of them trying to climb above what should be stiff resistance at the 50DMA. As always, I take this one step at a time, so I cannot confirm that I will quickly switch to bearish upon a retest (although that IS the technically correct bias to have!).
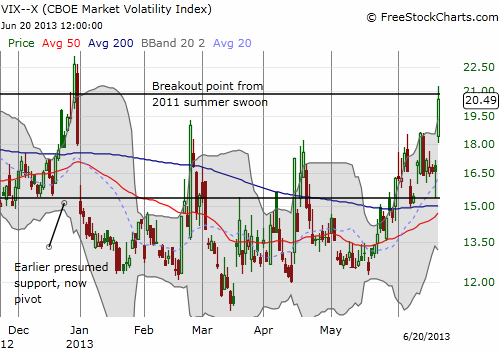
Most importantly, the VIX remains resilient. I have been pointing out how the VIX has not shown such an ability to stay aloft above the key 15.2 pivot. Today was the resounding confirmation of the warning the VIX has been delivering. The VIX ended its travels at a level that should send chills in anyone with a memory. The VIX traded above, and then pulled back just under, the same level that served as a breakdown point for the 2011 summer swoon.

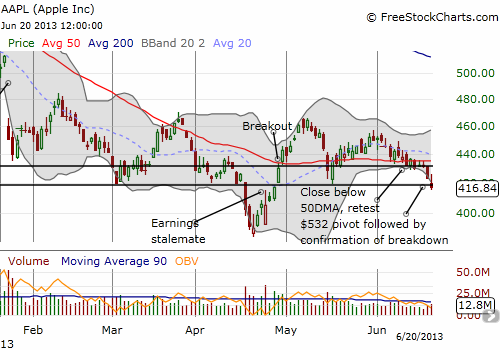
I conclude with a chart of Apple (AAPL). In a rare display of relative strength, AAPL actually rallied quickly from its lows before fading to rejoin the selling in the market. Earlier in the week, I tweeted that the declining 20DMA put the May low into play. Today, AAPL tested that low, bounced back sharply, but still ended up below the lower BB. This move completes a breakdown from 50DMA support and the old pivot around $532. While I still think the AAPL bottom will hold, it seems a gut-wrenching retest of those lows is in the cards…perhaps even BEFORE July earnings.

Note again that the “Apple Trading Model” (aka ATM) is working well in this case with AAPL getting progressively weaker going into the end of the week. After selling out of my puts, I dipped early into an AAPL call expiring NEXT Friday.

Black line: T2108 (measured on the right); Green line: S&P 500 (for comparative purposes)
Red line: T2108 Overbought (70%); Blue line: T2108 Oversold (20%)

Be careful out there!
Full disclosure: long SSO calls, long AAPL shares and calls
VIX Status: 20.5 (retested level that launched summer swoon in 2011)
General (Short-term) Trading Call: Scale into longs for short-term bounce from oversold conditions
Active T2108 periods: Day #1 under 30% (underperiod), Day #2 under 40%; Day #20 under 70% (underperiod)
Commentary
If I had a bearish bias coming into today, I would have collected a large payday on ProShares Ultra S&P 500 (SSO) puts. Even sticking with the older plan of playing a breakdown from the wedge would have yielded great results today as the S&P 500 (SPY) gapped down exactly under the bear/bull dividing line and sold off in a near straight line from there. However, just as I did not play the breakout (thank goodness for wariness ahead of the Fed meeting!), I did not play the bearish angle of today’s breakdown as I was on watch for oversold conditions.

Today’s 2.5% loss on the S&P 500 (SPY) was the index’s largest loss since a 3.7% plunge November 9, 2011. T2108 plunged in response with a gut-wrenching 39.6% loss down to 21%. This was T2108′s largest one-day loss since a 49.1% plunge on May 21, 2010 where T2108 hit an amazingly low 9.7%. The 52.0% 2-day plunge was T2108′s largest since a 56.1% 2-day loss on August 8, 2011 when T2108 closed at 11.5%. Since 1990, there have only been 18 occurrences of T2108 dropping at least as much as it has done in the past two days. Like today, all of these plunges happened below both the 20 and 50DMAs. At its low for the day, T2108 hit 19.8%, oversold conditions (the picture-perfect and sharp bounce from oversold levels tells me I am not the only one watching these levels closely!). Put this all together and not only is T2108 quasi-oversold, but it is also essentially (classically) oversold.
3rd party Ad. Not an offer or recommendation by Investing.com. See disclosure here or remove ads.

The sheer scale of what happened today took me off-guard. I did not think the market would hit oversold conditions until next week and certainly not drop with such ferocity!
As on previous occasions with the potential for (quasi) oversold conditions, I ran the T2108 Trading Model (TTM) to look for an early start on trading. As I noted in an earlier post, I learned that sensitivity analysis is important in interpreting the results. I have not yet adjusted the code to accommodate multiple scenarios, but I did run the model several times throughout the day. The results were VERY instructive. I tweeted some of these (in chronological order):
- If $SPY closed here, #T2108 model projecting 72% odds of up day tomorrow. Model surprisingly only depends on #T2108 close. Will monitor.
- Technicals worse, #T2108 model still has 72% odds of $SPY up Fri. Model now only depends on #VIX % chng. Will continue sensitivity analysis.
- Odds shot up to 82%. Model looking sufficiently robust. Depends on #VIX and #T2108 close. Scaling into $SSO calls. #120trade
- #T2108 model dropped odds of up day tomorrow to 64% (not so good). So I am thinking I get another opp to add to $SSO calls at lower prices.
- #T2108 model final odds for up day tomorrow = 68%. Borderline. Decision tree reduced to 1 node. Conditions ripe for $SPY gap down buying opp
3rd party Ad. Not an offer or recommendation by Investing.com. See disclosure here or remove ads.
The day ended with a projection of a 72.2% chance of an up day tomorrow (June 21st). The model is a single node because the entire “problem space” only contains 18 cases. And these 18 cases are remarkably similar to the current one. Of these 18 cases, the S&P 500 closed down only 5 times the following day. The range of returns has been extremely wide: as low as -6.6% on August 8, 2011 to +6.3% on November 21, 2008. Thirteen (13) of the eighteen (18) cases have occurred since 2007, one in 2011, and none in 2012. I said prepare for volatility this summer, and boy do we have it.
With the S&P 500 trading well below its lower-Bollinger Band, a PERFECT scenario tomorrow will be another gap down that really over-stretches the selling. I will be loading up on SSO calls at the point with T2108 most likely in a deep oversold position, and the index stretched well-beyond the typical band of recent volatility. Of course, I will not complain if the index instead gaps up tomorrow, but I think there is a lot more money to be made playing deep oversold levels.
Even though I remain bullish, I have heaps more caution to throw on the table for good measure. The S&P 500 has technically broken down. I can play oversold bounces for one, maybe two days – however long it takes to rally back into overhead resistance. The bulls now have a LOT to prove and will have a major hurdle ahead of them trying to climb above what should be stiff resistance at the 50DMA. As always, I take this one step at a time, so I cannot confirm that I will quickly switch to bearish upon a retest (although that IS the technically correct bias to have!).
3rd party Ad. Not an offer or recommendation by Investing.com. See disclosure here or remove ads.
Most importantly, the VIX remains resilient. I have been pointing out how the VIX has not shown such an ability to stay aloft above the key 15.2 pivot. Today was the resounding confirmation of the warning the VIX has been delivering. The VIX ended its travels at a level that should send chills in anyone with a memory. The VIX traded above, and then pulled back just under, the same level that served as a breakdown point for the 2011 summer swoon.

I conclude with a chart of Apple (AAPL). In a rare display of relative strength, AAPL actually rallied quickly from its lows before fading to rejoin the selling in the market. Earlier in the week, I tweeted that the declining 20DMA put the May low into play. Today, AAPL tested that low, bounced back sharply, but still ended up below the lower BB. This move completes a breakdown from 50DMA support and the old pivot around $532. While I still think the AAPL bottom will hold, it seems a gut-wrenching retest of those lows is in the cards…perhaps even BEFORE July earnings.

Note again that the “Apple Trading Model” (aka ATM) is working well in this case with AAPL getting progressively weaker going into the end of the week. After selling out of my puts, I dipped early into an AAPL call expiring NEXT Friday.

Black line: T2108 (measured on the right); Green line: S&P 500 (for comparative purposes)
3rd party Ad. Not an offer or recommendation by Investing.com. See disclosure here or remove ads.
Red line: T2108 Overbought (70%); Blue line: T2108 Oversold (20%)

Be careful out there!
Full disclosure: long SSO calls, long AAPL shares and calls
Which stock should you buy in your very next trade?
AI computing powers are changing the stock market. Investing.com's ProPicks AI includes 6 winning stock portfolios chosen by our advanced AI. In 2024 alone, ProPicks AI identified 2 stocks that surged over 150%, 4 additional stocks that leaped over 30%, and 3 more that climbed over 25%. Which stock will be the next to soar?
Unlock ProPicks AI